The Problem
Identifying changes in day-to-day trends for certain metrics has, frankly, always been a bit of a laborious task.
Example Scenario
Say, for example, that you wanted to review the changes in trends with respect to clicks from different continents. Up until now, the only way to do that was to generate a bunch of one-day reports and compare them. If you have had to do this before, you likely ended up exporting those reports to Excel and doing a bunch of copy and pasting to combine the parts together.
The Solution
Our solution to this problem was simply to add an option that lets you group most of the reports we offer by date.
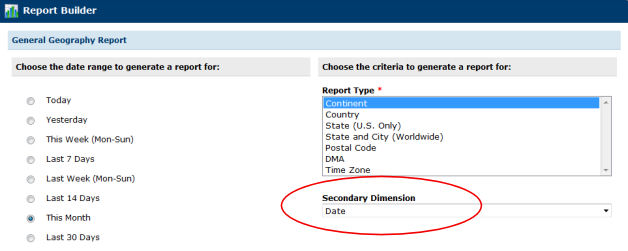
When you are viewing a summary report you will now see a Group by Date link in the upper right corner as shown in the following screenshot.
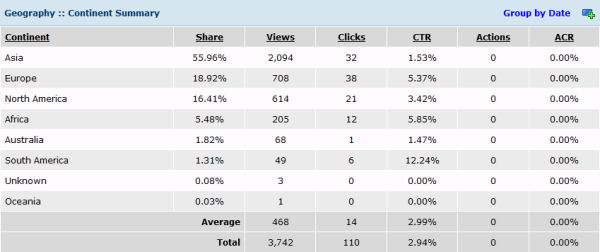
Clicking upon that link in a continents report like the one shown above will produce another more detailed report that shows you the daily figures for each continent it contains!
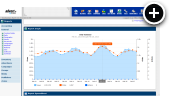
The following is a sample continents report, which is dimensioned by date and spans the month of April so you can easily see day-to-day changes in trends for any given continent contained in the summary report.
Having trouble viewing the sample report in the embedded viewer? Please click here to view it directly.
Final Thoughts
Hopefully this much needed reporting enhancement will save you some time in the near future. For now you can only group reports by date. However, we do have plans to allow grouping by other vectors, so stay tuned for that!
 Mike Cherichetti